
SANA camera delivery: why 25 fps can still mean a slow response
Six SANA camera runs separate native FPS, interpolated playback, buffering and visible response. Download the November 7 measurements and method.
A live AI video stream can look smooth while showing old input. In Windflow's November 7, 2026 SANA-Streaming experiment, six runs presented 24.9–25.0 frames per second, while the native stream supplied 12.44–12.49 fps and interpolation filled the intermediate frames. A still-camera scene change took about 2.8 seconds to appear. Playback cadence and responsiveness describe different parts of that result.
These are recorded measurements of a specific worker revision and synthetic camera client, not a current availability claim or a latency guarantee for every webcam, device or network. SANA is the model from NVlabs; the delivery implementation and experiment are Windflow's.
What we measured
The experiment used one H100 80GB HBM3 with a Xeon Platinum 8468 host. A headless Chrome client in the US target sent a synthetic camera at 12.5 fps, with a 1,280-pixel cap. The output canvas was 1280 × 704. The worker used RIFE ×2 interpolation and H.264 delivery. The measured worker revision was sana-streaming-e6666bdfc0f3.
The camera alternated two source portraits every three seconds. Moving-camera runs panned a fixed-size crop over the source: a four-second horizontal period and a 6.8-second vertical period. One moving run continued for about four minutes; the other runs lasted about 55 seconds including startup. The steady-state analysis spans are in the downloadable data.
| Run | Camera input | Native fps received | Presented fps | Excess freeze seconds per minute | Estimated backlog, frames |
|---|---|---|---|---|---|
| 01 | Moving, H.264 | 12.45 | 24.9 | 0.33 | 27 → 31 |
| 02 | Moving, H.264 | 12.44 | 24.9 | 0.17 | 26 → 30 |
| 03 | Moving, JPEG | 12.44 | 25.0 | 0.16 | 26 → 31 |
| 04 | Moving, H.264, four minutes | 12.49 | 25.0 | 0.37 | 26 → 31 |
| 05 | Still, fixed size, H.264 | 12.44 | 25.0 | 0.41 | 26 → 30 |
| 06 | Still, mixed size, H.264 | 12.44 | 24.9 | 0.33 | 26 → 30 |
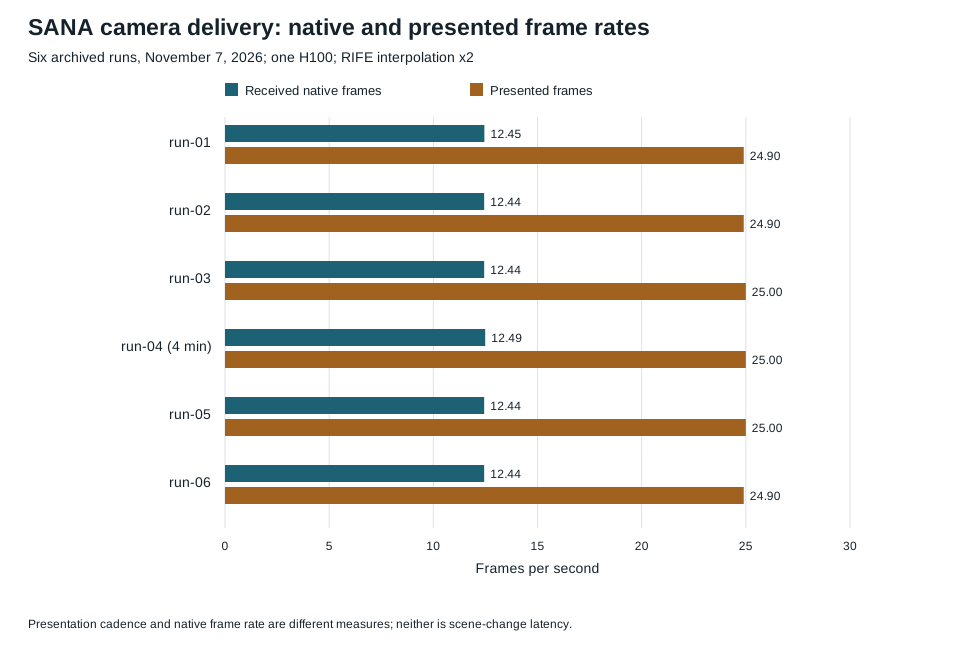
All six runs had zero observed holes in the worker's native frame sequence and zero source-encode failures. Interpolation produced approximately two packets per native frame. It increased the display cadence without doubling the rate at which the camera supplied new information.
Why stable playback did not remove the delay
The worker held approximately 26–31 source frames. At a 12.5 fps camera clock, 31 frames represent about 2.5 seconds of input history. This backlog is estimated from frames sent since ready minus native frames reported generated by the worker. It is not a direct capture timestamp for each displayed pixel.
The still-camera detector provides a separate response measurement. In run 05, 13 detected scene changes had a median of 2784.9 ms and p90 of 2908.4 ms from synthetic image swap to changed picture on screen. In run 06, 12 changes had a median of 2801.3 ms and p90 of 2856.6 ms. The moving-camera runs have no reported scene-change latency: that detector needs a still baseline.
These measurements support a practical conclusion: a flat queue can deliver a consistent experience while keeping it consistently late. Fixing freezes and reducing input age are separate engineering tasks.
The two delivery defects behind the earlier poor cadence
The preceding investigation found two independent worker problems. First, stacking mixed-size source frames could fail and discard a collected camera block. Resize-cropping each input to the model canvas before stacking removed that failure. Second, both the engine and transport paced the same camera-driven stream. After a hiccup the transport kept the lost time, so camera input accumulated faster than output drained.
The rebuilt revision included the encoder fix, and transport pacing was disabled for this profile. The follow-up experiment above checks that combination with still, mixed-size and moving input. It supports the measured frame rates on the tested host. It does not establish equivalent performance on every machine advertised as an H100.
How to reproduce the measurement design
- Record the worker revision, camera clock, model canvas, interpolation factor, transport and client region before starting.
- Send a repeatable fixed-size panning source, then repeat with source-size changes. Count source-encoder failures separately from lost network packets.
- Record native frame identities and client presentation timestamps. Report native and presented rates separately.
- Keep a long run to detect backlog growth. Estimate queued source frames from sent and generated counters and label that estimate.
- Use a separate still-source swap sequence for visible response. Match each swap to its detected change on screen; retain unmatched observations.
- Report each run and its analysis window. Keep initial startup outside steady-state cadence and report startup separately if needed.
Here, excess freeze time sums the amount beyond one median frame interval for presented-frame gaps longer than 100 ms, then normalizes that sum to a minute. Maximum packet-arrival gaps are a separate field; they must not be relabeled as maximum on-screen gaps.
Data, scope and next steps
Download the selected run data as JSON or CSV. The JSON includes definitions, analysis spans, scene-change sample counts, the archived source filename and its SHA-256. This public extract omits sandbox identifiers and operational logs. Raw browser captures were not retained in the committed archive, so the selected aggregates cannot independently reconstruct every displayed frame.
The experiment did not use a physical webcam, a rotating phone or a browser on a home/mobile network. It did not measure scene-change latency during panning. Its six runs are not six independent GPU hosts, and their frame-level samples are correlated within each run.
For integration, start with the SANA API guide. For an application decision, measure your own source-to-visible response using the latency guide, alongside frame rate and freezes. Windflow access is through private beta; request access before planning a live deployment.
FAQ
Does a 25 fps SANA stream mean the model generates 25 native fps?
No. These six runs received about 12.5 native fps and presented about 25 fps with RIFE ×2 interpolation. The two rates are published separately.
Why can a smooth stream react slowly to a camera change?
Queued input and playback buffering can retain old frames even when cadence is stable. The still-camera runs in this experiment showed about 2.8 seconds median scene-change-to-screen delay.
Was this a real webcam latency benchmark?
No. It used a synthetic camera in a headless Chrome client. Physical webcam capture, phone rotation, home networks and moving-camera scene-change latency remain outside the measurement.